\(\def\mathbi#1{\boldsymbol{\it #1}}\)
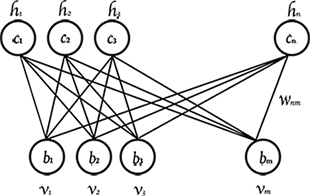
An RBM is a Markov Random Field defined over a bipartite undirected graph. The two disjoint sets of nodes are called (for a reason which we will look later) hidden and visible nodes/units. Let \(v_1, v_2, v_3, …, v_m\) be the visible nodes of the graph with the associated random variables \(\textbf{V} = (V_1, V_2, V_3, …, V_m)\). And let \(h_1, h_2, h_3, …, h_n\) be the hidden nodes of the graph with the associated random variables \(\textbf{H} = (H_1, H_2, H_3, …, H_n)\). By a little abuse of notation, we henceforth also refer to the values taken by the random variables \(H_i\) as \(h_i\) and the values taken by \(V_i\) as \(v_i\). The joint variables \(\textbf{H}\) and \(\textbf{V}\) take the values \(h\) and \(v\) respectively.
We will discuss binary RBMs, that is \((h,v) \in \{0,1\}^{m+n}\). Clearly, a bipartite graph the only maximal cliques are of the form \(\{h_i, v_j\}\). Thus the energy function \( E(\mathbi{h,v}) = \sum_{C \in \mathcal{C}} \ln \psi_C(\mathbi{h,v}) \) becomes \(\sum_i \sum_j \ln \psi_{ij}(\mathbi{h,v}) \). We assume \(\ln \psi_{ij}(\mathbi{h,v}) \) to be a bivariate polynomial of the form \(\alpha_{ij} h_iv_j + \alpha_i h_i + \alpha_j v_j \). Therefore we can write the whole energy function in the following form:
and thus,
This completely defines a binary RBM.
Since the above probability distribution by definition factorises over the binary RBM, by Hammersley-Clifford Theorem (described in part 1/3 ) we conclude that it satisfies the Global Markov Property. That is, hidden variables are independent given the state of the visible variables and vice-versa. Using this it can be proved that an RBM can be interpreted as a stochastic neural network where the nodes form neurons and the edges form connections between them. \(w_{ij}\) can be interpreted as weights of the edges \(ij\) and the \(b_j\)’s and \(c_i\)’s as bias terms of visible and hidden neurons respectively. The neurons can be interpreted to have a sigmoid activation function \(\sigma (x) = \frac{1}{1+e^{-x}}\). Thus,
Also, the marginal distribution of the observed variables \(p(v)\) can be easily proved to be:
Now comes the intuitive interpretation part of the RBM. An RBM can be considered as an unsupervised learning model in the following way. In unsupervised learning, given a set of observed sample data points we try to learn/find an unknown distribution from which they are hypothesized to be drawn from. Here, the RBM (or in general an MRF) graphical structure defines the unknown distribution parametrized by the parameters \(w_{ij}, b_j\) and \(c_i\). The visible nodes output the sample data points. We thus find the parameters which maximize the likelihood of the data set observed at the visible nodes. The hidden nodes are latent variables which do not correspond to any observations. Once the best set of parameters are found, the binary RBM can be interpreted as a mapping between the data point and the expected values of the hidden neurons i.e. the data point \(v \in \{0,1\}^m \) is mapped to \(y \in \mathbb{R}^n \) where \(y_i\) \( = p(H_i =1 \ | v)\) is the probability with which the hidden unit \(H_i\) is switched on . As discussed before, given an observed data point and a set of parameters, the hidden units/neurons \(H_i\) may be on or off with probability \(p(H_i =1 \ | v)\).
We now try to maximize the likelihood of the data.
Given a single training example \(\mathscr{v}\), the log-likelihood is given by:
Here \(\theta \) denotes the parameters of the RBM. \((\ref{eq5})\) can be optimized using the gradient descent method which requires to compute the gradient of the log-likelihood. It can be shown that:
For a set \(\mathcal{S} \) consisting of \(l\) data points which are i.i.d., the total likelihood is a product of likelihoods of individual data points and thus the total log-likelihood is the sum of log-likelihoods of individual data points. Thus to maximize the total log-likelihood using gradient descent method we need to find .
It can be shown that with respect to the parameter \(w_{ij}\) we get:
and thus:
where \(q \) is the empirical distribution of the data.
Similarly, we have:
and
The second terms in \((\ref{eq8})\), \((\ref{eq9})\) and \((\ref{eq10})\) require summing up over all values of visible units and hidden units which becomes computationally intractable. These terms are therefore approximated by taking independent samples from the model distribution using an MCMC method called Gibbs sampling discussed in the previous post part 1/3. However here, since the layer of hidden units and the layer of visible units do not have “intra-connections”, they are independent of each other and thus a single layer of hidden/visible units can be sampled jointly. That is, sampling \(h\) based on \(p(h \ | \ v)\) and then sampling \(v\) based on \(p(v \ | \ h)\). This method is called Blocked Gibbs sampling.
Yet however Blocked Gibbs sampling too requires high computational time to run the Markov chain for a sufficiently long time. We therefore introduce further approximations to find the gradient of the log-likelihood. One such technique/training method is called Contrastive Divergence. In the k-step Contrastive Divergence (CD-k), instead of sampling from a long Markov chain to find the second terms of \((\ref{eq8})\), \((\ref{eq9})\) and \((\ref{eq10})\) we try to estimate the complete right hand side of these equations altogether.
The procedure of estimation is as follows: The Blocked Gibbs chain is initialised with a training example \( \mathscr{v} \in \mathcal{S}\) which we write as \(\mathscr{v}^{(0)}\). At step t, we sample \(h^{(t)}\) from the distribution \(p(h \ | \ \mathscr{v}^{(t)})\). \(\mathscr{v}^{(t+1)}\) is then sampled from \(p(\mathscr{v} \ | \ h^{(t)})\). After \(k\) such steps, for a single training point the gradient of the parameter \(\theta \) of equation \((\ref{eq6})\) is then approximated by:
For all the training samples in \(\mathcal{S}\), the second term in equation \((\ref{eq11})\) becomes \( \sum_{\mathscr{v} \in \mathcal{S}} \sum_h p(h | \mathscr{v}^{(k)}) \frac{\partial E(h, \mathscr{v}^{(k)})}{\partial \theta}\) which can be written as \(l \) (the number of training samples) times . Also, because \(v^{(k)}\) can be interpreted as a random sample point from the distribution defined by the MRF model if \(k\) is large, we can further interpret the second term in \((\ref{eq11})\) as which is also the second term of equation \((\ref{eq6})\). The first term of \((\ref{eq11})\) is of course the first term of \((\ref{eq6})\). Thus, the contrastive divergence seems to intuitively converge to the gradient of \(\theta\) for large \(k\). However, \(v^{(k)}\) not being a sample from the stationary distribution of the Gibbs sampling Markov chain, the approximation is biased.
Many results have been derived to quantize this bias and the CD approximation error. It has also been shown that CD approximation does not necessary lead to a maximum likelihood estimate of the parameters \(\theta\) but however this and some modifications of CD remain the most important methods to find the gradient of the log-likelihood.